|
Download Data (XLS File) |
|
||||||||
|
||||||||
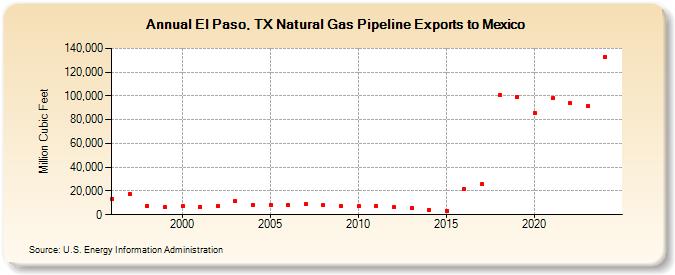
| El Paso, TX Natural Gas Pipeline Exports to Mexico (Million Cubic Feet) | ||||||||
| Decade | Year-0 | Year-1 | Year-2 | Year-3 | Year-4 | Year-5 | Year-6 | Year-7 | Year-8 | Year-9 |
|---|---|---|---|---|---|---|---|---|---|---|
| 1990's | 13,406 | 17,779 | 7,358 | 6,146 | ||||||
| 2000's | 7,458 | 6,843 | 7,632 | 11,453 | 8,462 | 8,473 | 8,143 | 8,682 | 7,859 | 7,119 |
| 2010's | 7,043 | 7,381 | 6,238 | 5,657 | 4,054 | 3,375 | 21,313 | 25,662 | 100,589 | 99,214 |
| 2020's | 85,690 | 97,891 | 93,981 | 91,422 | 132,799 | 114,020 |
| - = No Data Reported; -- = Not Applicable; NA = Not Available; W = Withheld to avoid disclosure of individual company data. |
| Release Date: 5/29/2026 |
| Next Release Date: 6/30/2026 |