|
Download Data (XLS File) |
|
||||||||
|
||||||||
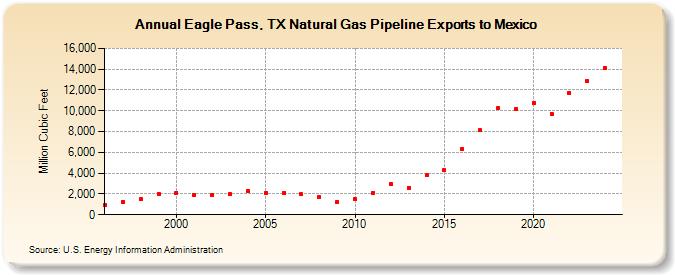
| Eagle Pass, TX Natural Gas Pipeline Exports to Mexico (Million Cubic Feet) | ||||||||
| Decade | Year-0 | Year-1 | Year-2 | Year-3 | Year-4 | Year-5 | Year-6 | Year-7 | Year-8 | Year-9 |
|---|---|---|---|---|---|---|---|---|---|---|
| 1990's | 942 | 1,260 | 1,471 | 1,990 | ||||||
| 2000's | 2,114 | 1,896 | 1,914 | 1,969 | 2,258 | 2,132 | 2,118 | 1,955 | 1,695 | 1,237 |
| 2010's | 1,471 | 2,114 | 2,970 | 2,608 | 3,801 | 4,282 | 6,305 | 8,104 | 10,225 | 10,129 |
| 2020's | 10,761 | 9,720 | 11,732 | 12,874 | 15,394 | 14,818 |
| - = No Data Reported; -- = Not Applicable; NA = Not Available; W = Withheld to avoid disclosure of individual company data. |
| Release Date: 6/30/2026 |
| Next Release Date: 7/31/2026 |