|
Download Data (XLS File) |
|
||||||||
|
||||||||
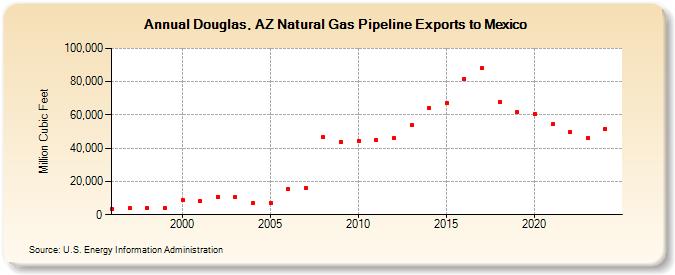
| Douglas, AZ Natural Gas Pipeline Exports to Mexico (Million Cubic Feet) | ||||||||
| Decade | Year-0 | Year-1 | Year-2 | Year-3 | Year-4 | Year-5 | Year-6 | Year-7 | Year-8 | Year-9 |
|---|---|---|---|---|---|---|---|---|---|---|
| 1990's | 3,405 | 3,901 | 4,133 | 4,041 | ||||||
| 2000's | 8,829 | 8,050 | 10,938 | 10,551 | 7,292 | 7,223 | 15,647 | 16,102 | 46,437 | 43,953 |
| 2010's | 44,470 | 44,836 | 46,069 | 53,679 | 64,072 | 67,144 | 81,826 | 88,171 | 67,968 | 61,497 |
| 2020's | 60,733 | 54,297 | 49,665 | 46,287 | 48,157 | 66,973 |
| - = No Data Reported; -- = Not Applicable; NA = Not Available; W = Withheld to avoid disclosure of individual company data. |
| Release Date: 6/30/2026 |
| Next Release Date: 7/31/2026 |