|
Download Data (XLS File) |
|
||||||||
|
||||||||
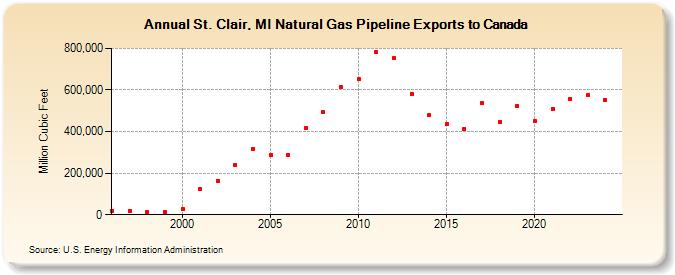
| St. Clair, MI Natural Gas Pipeline Exports to Canada (Million Cubic Feet) | ||||||||
| Decade | Year-0 | Year-1 | Year-2 | Year-3 | Year-4 | Year-5 | Year-6 | Year-7 | Year-8 | Year-9 |
|---|---|---|---|---|---|---|---|---|---|---|
| 1990's | 19,315 | 20,080 | 11,397 | 11,258 | ||||||
| 2000's | 29,654 | 122,293 | 164,084 | 238,444 | 317,797 | 286,804 | 286,582 | 418,765 | 492,235 | 612,369 |
| 2010's | 650,590 | 781,058 | 754,494 | 582,509 | 478,645 | 435,746 | 414,080 | 536,925 | 447,404 | 524,895 |
| 2020's | 449,623 | 509,872 | 558,789 | 574,575 | 552,719 | 600,297 |
| - = No Data Reported; -- = Not Applicable; NA = Not Available; W = Withheld to avoid disclosure of individual company data. |
| Release Date: 6/30/2026 |
| Next Release Date: 7/31/2026 |