|
Download Data (XLS File) |
|
|||||
|
|||||
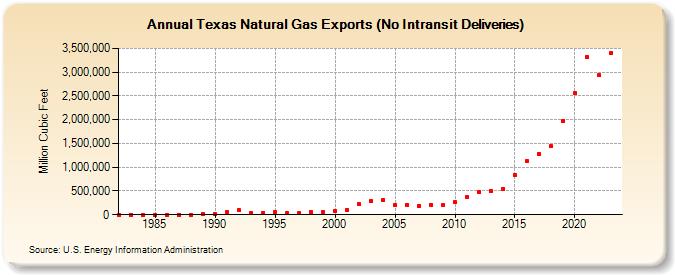
| Texas Natural Gas Exports (No Intransit Deliveries) (Million Cubic Feet) | |||||
| Decade | Year-0 | Year-1 | Year-2 | Year-3 | Year-4 | Year-5 | Year-6 | Year-7 | Year-8 | Year-9 |
|---|---|---|---|---|---|---|---|---|---|---|
| 1980's | 11 | 0 | 29 | 394 | 372 | 368 | 422 | 15,535 | ||
| 1990's | 13,983 | 58,851 | 93,408 | 36,423 | 44,041 | 61,241 | 30,435 | 34,163 | 46,933 | 53,260 |
| 2000's | 83,268 | 109,063 | 216,919 | 278,676 | 309,891 | 207,833 | 205,307 | 178,897 | 209,741 | 195,651 |
| 2010's | 257,158 | 374,188 | 474,060 | 499,809 | 546,308 | 845,949 | 1,129,434 | 1,280,647 | 1,436,793 | 1,972,914 |
| 2020's | 2,557,093 | 3,314,398 | 2,934,586 | 3,399,059 | 3,463,889 |
| - = No Data Reported; -- = Not Applicable; NA = Not Available; W = Withheld to avoid disclosure of individual company data. |
| Release Date: 6/30/2026 |
| Next Release Date: 7/31/2026 |