|
Download Data (XLS File) |
|
|||||
|
|||||
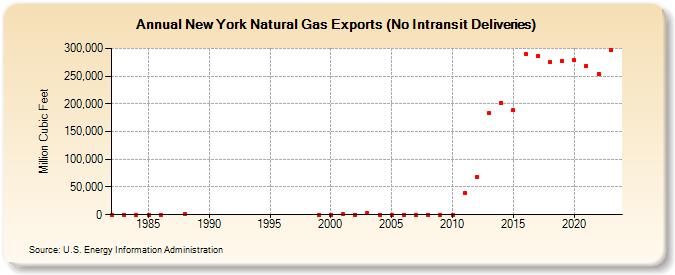
| New York Natural Gas Exports (No Intransit Deliveries) (Million Cubic Feet) | |||||
| Decade | Year-0 | Year-1 | Year-2 | Year-3 | Year-4 | Year-5 | Year-6 | Year-7 | Year-8 | Year-9 |
|---|---|---|---|---|---|---|---|---|---|---|
| 1980's | 0 | 0 | 0 | 0 | 0 | 1,800 | ||||
| 1990's | 0 | |||||||||
| 2000's | 0 | 594 | 40 | 2,215 | 3 | 0 | 0 | 2 | 0 | 0 |
| 2010's | 0 | 38,783 | 68,843 | 184,071 | 201,691 | 188,634 | 288,980 | 286,338 | 275,654 | 276,594 |
| 2020's | 278,573 | 268,103 | 254,700 | 296,911 | 284,505 |
| - = No Data Reported; -- = Not Applicable; NA = Not Available; W = Withheld to avoid disclosure of individual company data. |
| Release Date: 6/30/2026 |
| Next Release Date: 7/31/2026 |