|
Download Data (XLS File) |
|
|||||
|
|||||
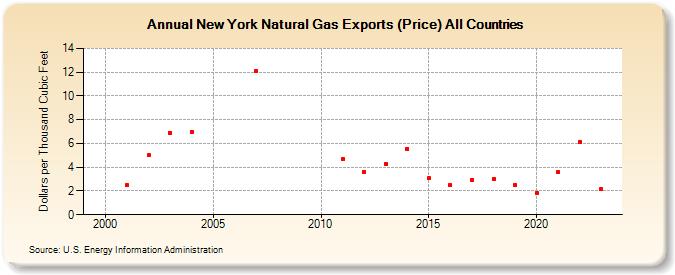
| New York Natural Gas Exports (Price) All Countries (Dollars per Thousand Cubic Feet) | |||||
| Decade | Year-0 | Year-1 | Year-2 | Year-3 | Year-4 | Year-5 | Year-6 | Year-7 | Year-8 | Year-9 |
|---|---|---|---|---|---|---|---|---|---|---|
| 1990's | -- | |||||||||
| 2000's | -- | 2.49 | 5.00 | 6.90 | 6.99 | -- | -- | 12.07 | -- | -- |
| 2010's | -- | 4.69 | 3.61 | 4.29 | 5.56 | 3.06 | 2.50 | 2.94 | 3.03 | 2.51 |
| 2020's | 1.84 | 3.57 | 6.16 | 2.14 | 1.90 |
| - = No Data Reported; -- = Not Applicable; NA = Not Available; W = Withheld to avoid disclosure of individual company data. |
| Release Date: 6/30/2026 |
| Next Release Date: 7/31/2026 |