|
Download Data (XLS File) |
|
|||||
|
|||||
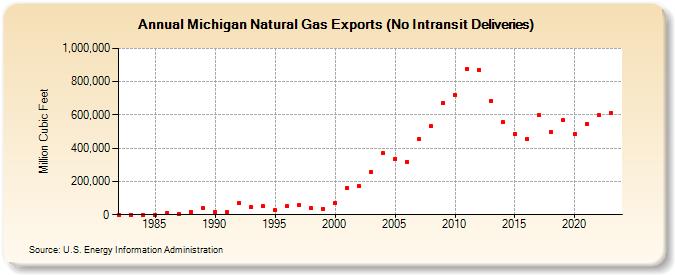
| Michigan Natural Gas Exports (No Intransit Deliveries) (Million Cubic Feet) | |||||
| Decade | Year-0 | Year-1 | Year-2 | Year-3 | Year-4 | Year-5 | Year-6 | Year-7 | Year-8 | Year-9 |
|---|---|---|---|---|---|---|---|---|---|---|
| 1980's | 0 | 0 | 0 | 0 | 9,113 | 3,257 | 17,900 | 38,361 | ||
| 1990's | 17,284 | 14,751 | 67,763 | 44,413 | 49,470 | 26,948 | 50,363 | 56,447 | 39,683 | 36,998 |
| 2000's | 70,980 | 161,588 | 171,515 | 259,597 | 368,947 | 337,818 | 317,291 | 455,216 | 531,333 | 673,318 |
| 2010's | 721,075 | 876,267 | 872,620 | 684,510 | 554,675 | 486,675 | 457,780 | 596,815 | 496,830 | 566,895 |
| 2020's | 485,750 | 547,143 | 597,496 | 612,163 | 594,496 |
| - = No Data Reported; -- = Not Applicable; NA = Not Available; W = Withheld to avoid disclosure of individual company data. |
| Release Date: 6/30/2026 |
| Next Release Date: 7/31/2026 |