|
Download Data (XLS File) |
|
|||||
|
|||||
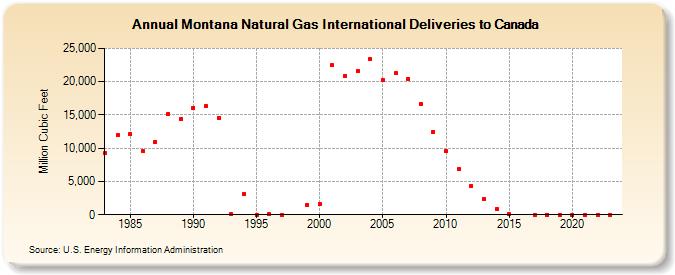
| Montana Natural Gas International Deliveries to Canada (Million Cubic Feet) | |||||
| Decade | Year-0 | Year-1 | Year-2 | Year-3 | Year-4 | Year-5 | Year-6 | Year-7 | Year-8 | Year-9 |
|---|---|---|---|---|---|---|---|---|---|---|
| 1980's | 9,255 | 11,946 | 12,148 | 9,524 | 10,938 | 15,119 | 14,454 | |||
| 1990's | 16,088 | 16,338 | 14,569 | 106 | 3,087 | 0 | 91 | 0 | 1,510 | |
| 2000's | 1,606 | 22,436 | 20,882 | 21,635 | 23,379 | 20,236 | 21,245 | 20,420 | 16,613 | 12,504 |
| 2010's | 9,516 | 6,826 | 4,332 | 2,353 | 891 | 35 | 0 | 1 | 1 | |
| 2020's | 0 | 0 | 2 | 2 | 1 |
| - = No Data Reported; -- = Not Applicable; NA = Not Available; W = Withheld to avoid disclosure of individual company data. |
| Release Date: 6/30/2026 |
| Next Release Date: 7/31/2026 |