|
Download Data (XLS File) |
|
|||||
|
|||||
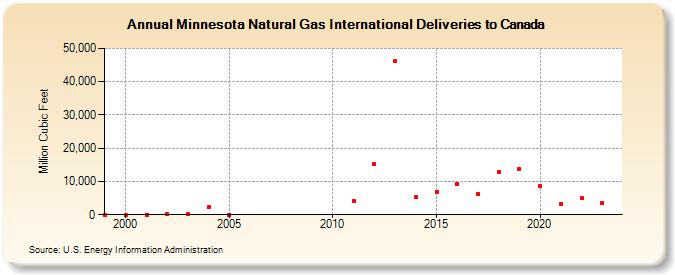
| Minnesota Natural Gas International Deliveries to Canada (Million Cubic Feet) | |||||
| Decade | Year-0 | Year-1 | Year-2 | Year-3 | Year-4 | Year-5 | Year-6 | Year-7 | Year-8 | Year-9 |
|---|---|---|---|---|---|---|---|---|---|---|
| 1990's | 0 | |||||||||
| 2000's | 0 | 0 | 71 | 172 | 2,193 | 0 | ||||
| 2010's | 3,975 | 15,106 | 46,124 | 5,474 | 6,971 | 9,297 | 6,330 | 12,882 | 13,668 | |
| 2020's | 8,696 | 3,238 | 5,047 | 3,504 | 3,936 |
| - = No Data Reported; -- = Not Applicable; NA = Not Available; W = Withheld to avoid disclosure of individual company data. |
| Release Date: 6/30/2026 |
| Next Release Date: 7/31/2026 |