|
Download Data (XLS File) |
|
|||||
|
|||||
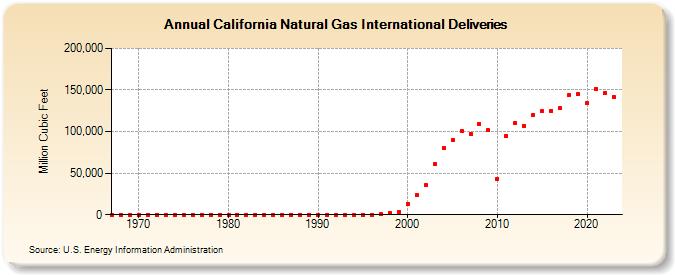
| California Natural Gas International Deliveries (Million Cubic Feet) | |||||
| Decade | Year-0 | Year-1 | Year-2 | Year-3 | Year-4 | Year-5 | Year-6 | Year-7 | Year-8 | Year-9 |
|---|---|---|---|---|---|---|---|---|---|---|
| 1960's | 0 | 0 | 0 | |||||||
| 1970's | 0 | 0 | 0 | 0 | 0 | 0 | 0 | 0 | 0 | 0 |
| 1980's | 0 | 0 | 0 | 0 | 0 | 0 | 0 | 0 | 0 | 0 |
| 1990's | 0 | 0 | 0 | 0 | 0 | 0 | 0 | 308 | 2,067 | 3,761 |
| 2000's | 13,152 | 23,320 | 35,305 | 60,857 | 80,019 | 89,987 | 101,101 | 96,757 | 109,127 | 101,422 |
| 2010's | 43,278 | 94,433 | 110,656 | 107,273 | 120,359 | 124,276 | 125,215 | 127,951 | 143,940 | 145,107 |
| 2020's | 133,744 | 151,732 | 146,555 | 142,063 | 155,767 |
| - = No Data Reported; -- = Not Applicable; NA = Not Available; W = Withheld to avoid disclosure of individual company data. |
| Release Date: 6/30/2026 |
| Next Release Date: 7/31/2026 |