|
Download Data (XLS File) |
|
|||||
|
|||||
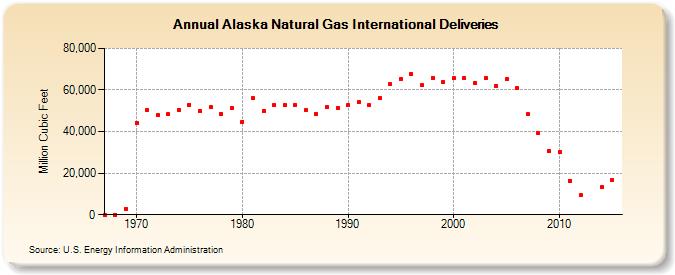
| Alaska Natural Gas International Deliveries (Million Cubic Feet) | |||||
| Decade | Year-0 | Year-1 | Year-2 | Year-3 | Year-4 | Year-5 | Year-6 | Year-7 | Year-8 | Year-9 |
|---|---|---|---|---|---|---|---|---|---|---|
| 1960's | 0 | 0 | 2,982 | |||||||
| 1970's | 44,257 | 50,231 | 47,882 | 48,346 | 50,258 | 53,002 | 49,780 | 51,655 | 48,434 | 51,289 |
| 1980's | 44,732 | 55,929 | 49,861 | 52,857 | 52,840 | 52,883 | 50,172 | 48,599 | 51,573 | 51,424 |
| 1990's | 52,546 | 54,005 | 52,532 | 55,989 | 62,682 | 65,283 | 67,648 | 62,187 | 65,951 | 63,607 |
| 2000's | 65,610 | 65,753 | 63,439 | 65,698 | 62,099 | 65,124 | 60,765 | 48,396 | 39,164 | 30,536 |
| 2010's | 30,100 | 16,398 | 9,342 | 13,310 | 16,519 |
| - = No Data Reported; -- = Not Applicable; NA = Not Available; W = Withheld to avoid disclosure of individual company data. |
| Release Date: 6/30/2026 |
| Next Release Date: 7/31/2026 |