|
Download Data (XLS File) |
|
||||||||
|
||||||||
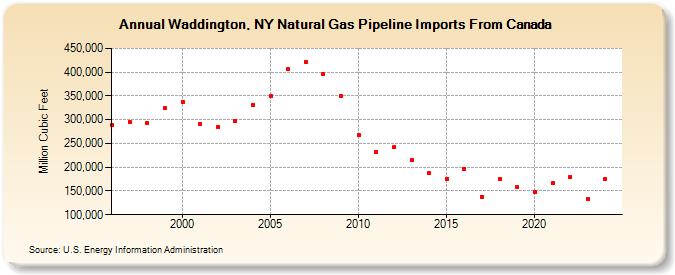
| Waddington, NY Natural Gas Pipeline Imports From Canada (Million Cubic Feet) | ||||||||
| Decade | Year-0 | Year-1 | Year-2 | Year-3 | Year-4 | Year-5 | Year-6 | Year-7 | Year-8 | Year-9 |
|---|---|---|---|---|---|---|---|---|---|---|
| 1990's | 288,807 | 295,568 | 293,234 | 324,400 | ||||||
| 2000's | 337,989 | 290,981 | 285,188 | 296,989 | 331,234 | 349,230 | 406,033 | 422,315 | 395,758 | 349,980 |
| 2010's | 267,227 | 231,831 | 241,506 | 214,671 | 187,219 | 175,194 | 197,095 | 137,903 | 175,494 | 157,781 |
| 2020's | 147,557 | 166,716 | 180,254 | 133,842 | 175,435 | 181,601 |
| - = No Data Reported; -- = Not Applicable; NA = Not Available; W = Withheld to avoid disclosure of individual company data. |
| Release Date: 6/30/2026 |
| Next Release Date: 7/31/2026 |