|
Download Data (XLS File) |
|
||||||||
|
||||||||
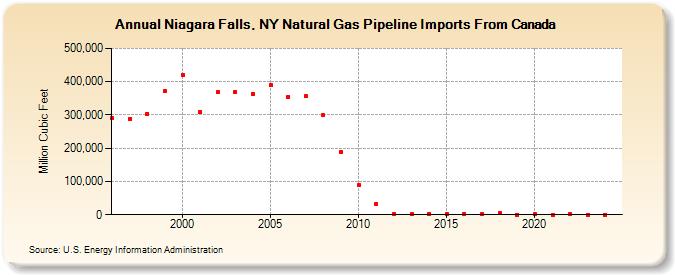
| Niagara Falls, NY Natural Gas Pipeline Imports From Canada (Million Cubic Feet) | ||||||||
| Decade | Year-0 | Year-1 | Year-2 | Year-3 | Year-4 | Year-5 | Year-6 | Year-7 | Year-8 | Year-9 |
|---|---|---|---|---|---|---|---|---|---|---|
| 1990's | 291,193 | 288,865 | 303,599 | 372,515 | ||||||
| 2000's | 421,016 | 308,102 | 367,448 | 369,052 | 363,350 | 390,272 | 354,703 | 356,529 | 298,911 | 188,525 |
| 2010's | 88,983 | 32,770 | 3,159 | 1,650 | 2,957 | 2,539 | 3,281 | 2,631 | 3,880 | 635 |
| 2020's | 1,005 | 154 | 1,774 | 99 | 339 | 2,003 |
| - = No Data Reported; -- = Not Applicable; NA = Not Available; W = Withheld to avoid disclosure of individual company data. |
| Release Date: 6/30/2026 |
| Next Release Date: 7/31/2026 |