|
Download Data (XLS File) |
|
||||||||
|
||||||||
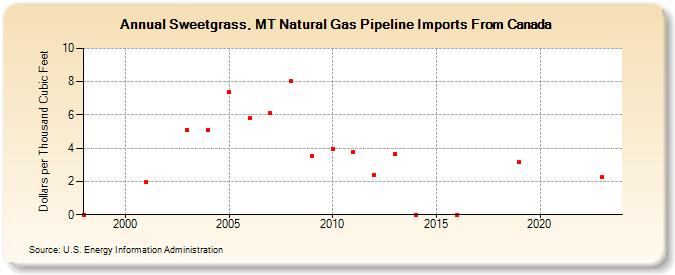
| Sweetgrass, MT Natural Gas Pipeline Imports From Canada (Dollars per Thousand Cubic Feet) | ||||||||
| Decade | Year-0 | Year-1 | Year-2 | Year-3 | Year-4 | Year-5 | Year-6 | Year-7 | Year-8 | Year-9 |
|---|---|---|---|---|---|---|---|---|---|---|
| 1990's | NA | NA | ||||||||
| 2000's | NA | 1.94 | NA | 5.09 | 5.12 | 7.37 | 5.81 | 6.12 | 8.02 | 3.52 |
| 2010's | 3.98 | 3.77 | 2.41 | 3.67 | -- | -- | -- | -- | -- | 3.14 |
| 2020's | -- | -- | -- | 2.27 | -- |
| - = No Data Reported; -- = Not Applicable; NA = Not Available; W = Withheld to avoid disclosure of individual company data. |
| Release Date: 6/30/2026 |
| Next Release Date: 7/31/2026 |