|
Download Data (XLS File) |
|
|||||
|
|||||
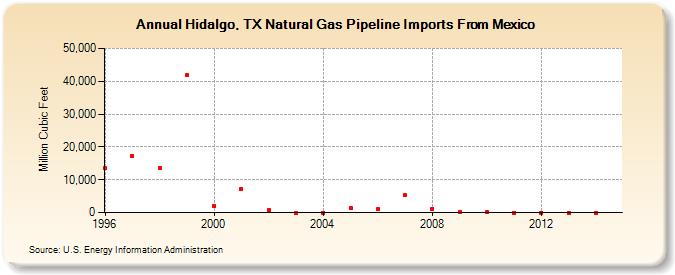
| Hidalgo, TX Natural Gas Pipeline Imports From Mexico (Million Cubic Feet) | |||||
| Decade | Year-0 | Year-1 | Year-2 | Year-3 | Year-4 | Year-5 | Year-6 | Year-7 | Year-8 | Year-9 |
|---|---|---|---|---|---|---|---|---|---|---|
| 1990's | 13,609 | 17,243 | 13,496 | 41,879 | ||||||
| 2000's | 2,093 | 7,292 | 782 | 0 | 0 | 1,342 | 967 | 5,259 | 1,201 | 284 |
| 2010's | 62 | 0 | 0 | 0 | 0 |
| - = No Data Reported; -- = Not Applicable; NA = Not Available; W = Withheld to avoid disclosure of individual company data. |
| Release Date: 6/30/2026 |
| Next Release Date: 7/31/2026 |