|
Download Data (XLS File) |
|
||||||||
|
||||||||
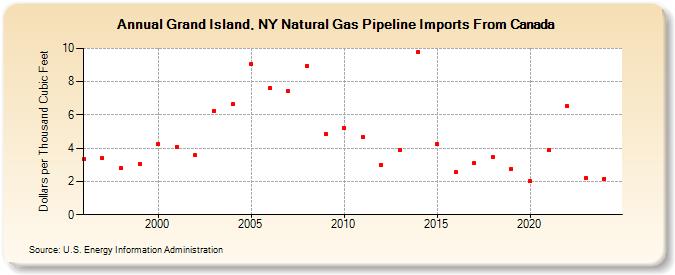
| Grand Island, NY Natural Gas Pipeline Imports From Canada (Dollars per Thousand Cubic Feet) | ||||||||
| Decade | Year-0 | Year-1 | Year-2 | Year-3 | Year-4 | Year-5 | Year-6 | Year-7 | Year-8 | Year-9 |
|---|---|---|---|---|---|---|---|---|---|---|
| 1990's | 3.35 | 3.42 | 2.80 | 3.07 | ||||||
| 2000's | 4.24 | 4.08 | 3.57 | 6.26 | 6.63 | 9.07 | 7.61 | 7.41 | 8.94 | 4.85 |
| 2010's | 5.20 | 4.68 | 3.01 | 3.92 | 9.80 | 4.23 | 2.54 | 3.12 | 3.45 | 2.75 |
| 2020's | 2.00 | 3.90 | 6.53 | 2.22 | 2.17 | 4.05 |
| - = No Data Reported; -- = Not Applicable; NA = Not Available; W = Withheld to avoid disclosure of individual company data. |
| Release Date: 6/30/2026 |
| Next Release Date: 7/31/2026 |