|
Download Data (XLS File) |
|
||||||||
|
||||||||
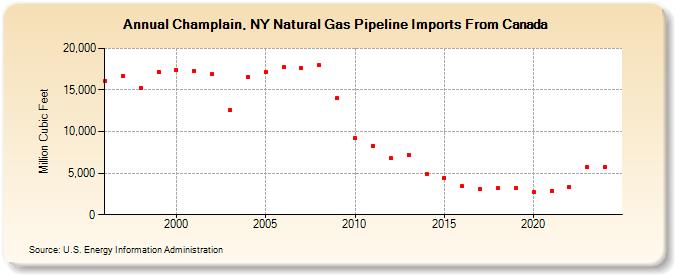
| Champlain, NY Natural Gas Pipeline Imports From Canada (Million Cubic Feet) | ||||||||
| Decade | Year-0 | Year-1 | Year-2 | Year-3 | Year-4 | Year-5 | Year-6 | Year-7 | Year-8 | Year-9 |
|---|---|---|---|---|---|---|---|---|---|---|
| 1990's | 16,104 | 16,669 | 15,258 | 17,171 | ||||||
| 2000's | 17,436 | 17,329 | 16,904 | 12,579 | 16,502 | 17,142 | 17,721 | 17,666 | 17,964 | 13,986 |
| 2010's | 9,173 | 8,293 | 6,766 | 7,228 | 4,922 | 4,446 | 3,408 | 3,137 | 3,161 | 3,156 |
| 2020's | 2,698 | 2,857 | 3,340 | 5,699 | 5,733 | 5,951 |
| - = No Data Reported; -- = Not Applicable; NA = Not Available; W = Withheld to avoid disclosure of individual company data. |
| Release Date: 6/30/2026 |
| Next Release Date: 7/31/2026 |