|
Download Data (XLS File) |
|
||||||||
|
||||||||
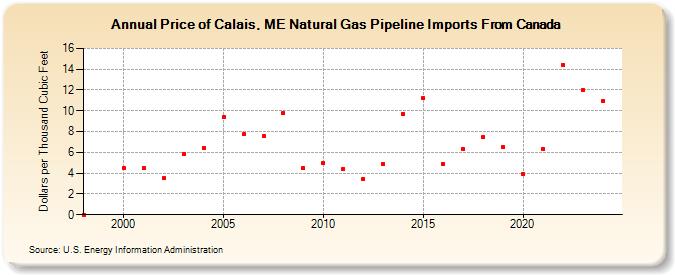
| Price of Calais, ME Natural Gas Pipeline Imports From Canada (Dollars per Thousand Cubic Feet) | ||||||||
| Decade | Year-0 | Year-1 | Year-2 | Year-3 | Year-4 | Year-5 | Year-6 | Year-7 | Year-8 | Year-9 |
|---|---|---|---|---|---|---|---|---|---|---|
| 1990's | NA | NA | ||||||||
| 2000's | 4.50 | 4.47 | 3.49 | 5.85 | 6.44 | 9.40 | 7.73 | 7.57 | 9.77 | 4.48 |
| 2010's | 4.94 | 4.40 | 3.44 | 4.86 | 9.70 | 11.22 | 4.90 | 6.29 | 7.45 | 6.51 |
| 2020's | 3.91 | 6.30 | 14.45 | 11.98 | 10.93 | 12.82 |
| - = No Data Reported; -- = Not Applicable; NA = Not Available; W = Withheld to avoid disclosure of individual company data. |
| Release Date: 6/30/2026 |
| Next Release Date: 7/31/2026 |