|
Download Data (XLS File) |
|
||||||||
|
||||||||
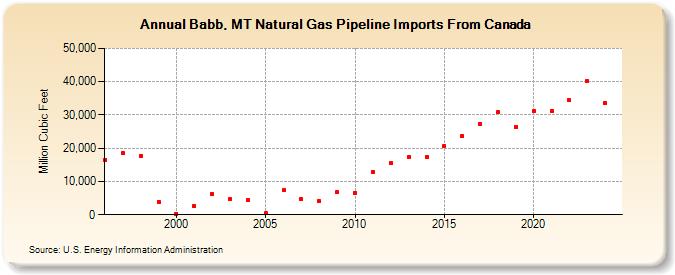
| Babb, MT Natural Gas Pipeline Imports From Canada (Million Cubic Feet) | ||||||||
| Decade | Year-0 | Year-1 | Year-2 | Year-3 | Year-4 | Year-5 | Year-6 | Year-7 | Year-8 | Year-9 |
|---|---|---|---|---|---|---|---|---|---|---|
| 1990's | 16,545 | 18,477 | 17,776 | 3,841 | ||||||
| 2000's | 295 | 2,571 | 6,326 | 4,645 | 4,333 | 396 | 7,343 | 4,580 | 4,057 | 6,702 |
| 2010's | 6,671 | 12,807 | 15,525 | 17,235 | 17,421 | 20,708 | 23,733 | 27,325 | 30,791 | 26,494 |
| 2020's | 31,084 | 31,148 | 34,380 | 40,149 | 33,544 | 36,538 |
| - = No Data Reported; -- = Not Applicable; NA = Not Available; W = Withheld to avoid disclosure of individual company data. |
| Release Date: 6/30/2026 |
| Next Release Date: 7/31/2026 |