|
Download Data (XLS File) |
|
|||||
|
|||||
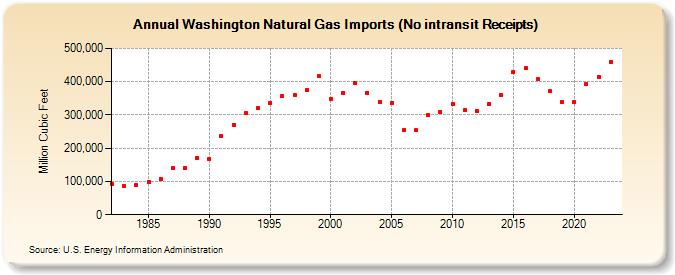
| Washington Natural Gas Imports (No intransit Receipts) (Million Cubic Feet) | |||||
| Decade | Year-0 | Year-1 | Year-2 | Year-3 | Year-4 | Year-5 | Year-6 | Year-7 | Year-8 | Year-9 |
|---|---|---|---|---|---|---|---|---|---|---|
| 1980's | 92,027 | 87,242 | 89,925 | 99,329 | 105,996 | 139,021 | 140,826 | 170,832 | ||
| 1990's | 168,441 | 235,614 | 270,477 | 306,030 | 320,362 | 335,866 | 356,711 | 360,261 | 374,666 | 415,636 |
| 2000's | 347,992 | 366,050 | 394,929 | 366,257 | 339,051 | 336,684 | 255,743 | 254,086 | 300,453 | 309,516 |
| 2010's | 332,358 | 313,922 | 312,236 | 333,050 | 359,348 | 429,653 | 440,984 | 406,540 | 371,775 | 339,908 |
| 2020's | 339,120 | 392,570 | 415,284 | 457,705 | 465,059 |
| - = No Data Reported; -- = Not Applicable; NA = Not Available; W = Withheld to avoid disclosure of individual company data. |
| Release Date: 6/30/2026 |
| Next Release Date: 7/31/2026 |