|
Download Data (XLS File) |
|
|||||
|
|||||
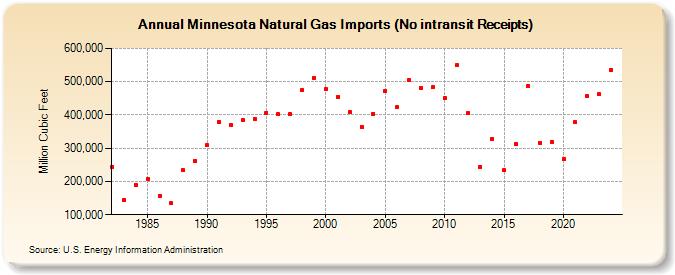
| Minnesota Natural Gas Imports (No intransit Receipts) (Million Cubic Feet) | |||||
| Decade | Year-0 | Year-1 | Year-2 | Year-3 | Year-4 | Year-5 | Year-6 | Year-7 | Year-8 | Year-9 |
|---|---|---|---|---|---|---|---|---|---|---|
| 1980's | 243,900 | 144,798 | 190,418 | 206,613 | 157,662 | 134,099 | 233,331 | 262,402 | ||
| 1990's | 308,581 | 378,492 | 369,137 | 383,702 | 387,466 | 406,883 | 401,473 | 402,706 | 475,152 | 512,135 |
| 2000's | 476,958 | 454,833 | 408,597 | 364,725 | 404,091 | 472,600 | 422,847 | 504,676 | 481,748 | 482,749 |
| 2010's | 451,405 | 548,686 | 406,327 | 243,805 | 328,610 | 233,011 | 312,263 | 487,541 | 316,945 | 319,069 |
| 2020's | 267,337 | 378,456 | 455,900 | 461,494 | 536,083 |
| - = No Data Reported; -- = Not Applicable; NA = Not Available; W = Withheld to avoid disclosure of individual company data. |
| Release Date: 6/30/2026 |
| Next Release Date: 7/31/2026 |