|
Download Data (XLS File) |
|
|||||
|
|||||
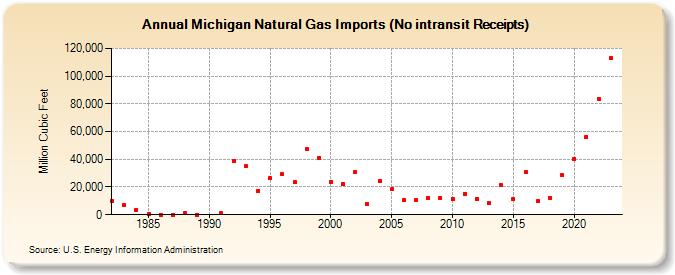
| Michigan Natural Gas Imports (No intransit Receipts) (Million Cubic Feet) | |||||
| Decade | Year-0 | Year-1 | Year-2 | Year-3 | Year-4 | Year-5 | Year-6 | Year-7 | Year-8 | Year-9 |
|---|---|---|---|---|---|---|---|---|---|---|
| 1980's | 10,027 | 6,951 | 3,683 | 467 | 0 | 136 | 997 | 0 | ||
| 1990's | 1,151 | 38,568 | 34,874 | 17,320 | 26,475 | 29,043 | 23,356 | 47,343 | 41,194 | |
| 2000's | 23,369 | 22,151 | 30,463 | 7,716 | 24,272 | 18,281 | 10,434 | 10,590 | 12,109 | 12,216 |
| 2010's | 11,365 | 15,193 | 11,630 | 8,521 | 21,248 | 10,985 | 30,541 | 9,712 | 12,414 | 28,309 |
| 2020's | 40,324 | 56,097 | 83,714 | 112,959 | 139,349 |
| - = No Data Reported; -- = Not Applicable; NA = Not Available; W = Withheld to avoid disclosure of individual company data. |
| Release Date: 6/30/2026 |
| Next Release Date: 7/31/2026 |