|
Download Data (XLS File) |
|
|||||
|
|||||
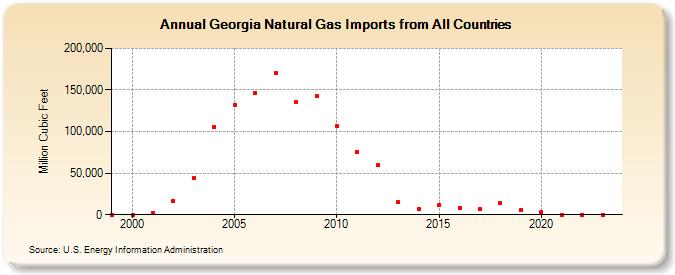
| Georgia Natural Gas Imports from All Countries (Million Cubic Feet) | |||||
| Decade | Year-0 | Year-1 | Year-2 | Year-3 | Year-4 | Year-5 | Year-6 | Year-7 | Year-8 | Year-9 |
|---|---|---|---|---|---|---|---|---|---|---|
| 1990's | 0 | |||||||||
| 2000's | 0 | 2,563 | 16,837 | 43,927 | 105,203 | 132,062 | 146,766 | 170,243 | 135,711 | 142,244 |
| 2010's | 106,454 | 75,641 | 59,266 | 15,575 | 7,155 | 11,786 | 8,673 | 6,514 | 14,500 | 5,648 |
| 2020's | 2,693 | 0 | 0 | 0 | 0 |
| - = No Data Reported; -- = Not Applicable; NA = Not Available; W = Withheld to avoid disclosure of individual company data. |
| Release Date: 6/30/2026 |
| Next Release Date: 7/31/2026 |