|
Download Data (XLS File) |
|
|||||
|
|||||
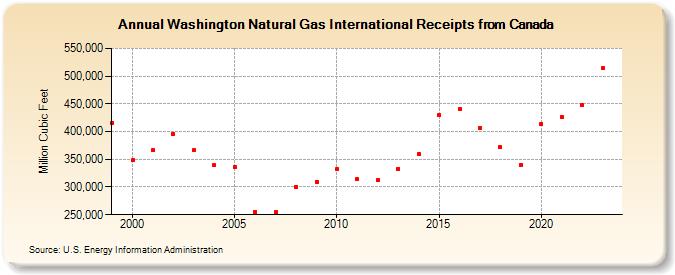
| Washington Natural Gas International Receipts from Canada (Million Cubic Feet) | |||||
| Decade | Year-0 | Year-1 | Year-2 | Year-3 | Year-4 | Year-5 | Year-6 | Year-7 | Year-8 | Year-9 |
|---|---|---|---|---|---|---|---|---|---|---|
| 1990's | 415,636 | |||||||||
| 2000's | 347,992 | 366,050 | 394,929 | 366,257 | 339,051 | 336,684 | 255,743 | 254,086 | 300,453 | 309,516 |
| 2010's | 332,358 | 313,922 | 312,236 | 333,050 | 359,348 | 429,653 | 440,984 | 406,540 | 371,775 | 339,908 |
| 2020's | 413,890 | 426,138 | 448,757 | 514,092 | 518,130 |
| - = No Data Reported; -- = Not Applicable; NA = Not Available; W = Withheld to avoid disclosure of individual company data. |
| Release Date: 6/30/2026 |
| Next Release Date: 7/31/2026 |