|
Download Data (XLS File) |
|
|||||
|
|||||
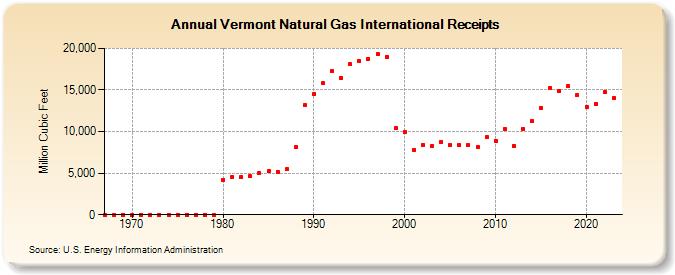
| Vermont Natural Gas International Receipts (Million Cubic Feet) | |||||
| Decade | Year-0 | Year-1 | Year-2 | Year-3 | Year-4 | Year-5 | Year-6 | Year-7 | Year-8 | Year-9 |
|---|---|---|---|---|---|---|---|---|---|---|
| 1960's | 0 | 0 | 0 | |||||||
| 1970's | 0 | 0 | 0 | 0 | 0 | 0 | 0 | 0 | 0 | 0 |
| 1980's | 4,221 | 4,589 | 4,519 | 4,610 | 4,994 | 5,213 | 5,137 | 5,453 | 8,105 | 13,152 |
| 1990's | 14,512 | 15,796 | 17,248 | 16,424 | 18,091 | 18,429 | 18,736 | 19,343 | 18,998 | 10,391 |
| 2000's | 9,980 | 7,815 | 8,421 | 8,272 | 8,761 | 8,392 | 8,404 | 8,366 | 8,162 | 9,319 |
| 2010's | 8,895 | 10,319 | 8,304 | 10,324 | 11,287 | 12,844 | 15,248 | 14,852 | 15,426 | 14,378 |
| 2020's | 12,934 | 13,371 | 14,744 | 14,055 | 12,636 |
| - = No Data Reported; -- = Not Applicable; NA = Not Available; W = Withheld to avoid disclosure of individual company data. |
| Release Date: 6/30/2026 |
| Next Release Date: 7/31/2026 |