|
Download Data (XLS File) |
|
|||||
|
|||||
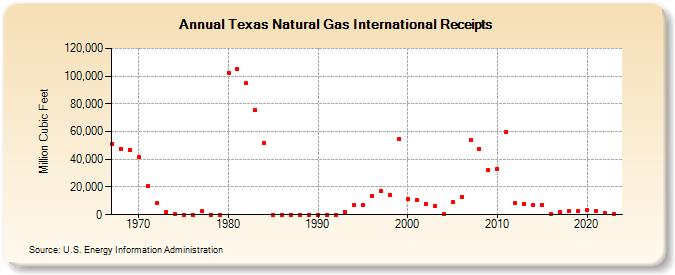
| Texas Natural Gas International Receipts (Million Cubic Feet) | |||||
| Decade | Year-0 | Year-1 | Year-2 | Year-3 | Year-4 | Year-5 | Year-6 | Year-7 | Year-8 | Year-9 |
|---|---|---|---|---|---|---|---|---|---|---|
| 1960's | 50,971 | 47,423 | 46,845 | |||||||
| 1970's | 41,336 | 20,689 | 8,141 | 1,632 | 222 | 0 | 0 | 2,384 | 0 | 0 |
| 1980's | 102,410 | 105,013 | 94,794 | 75,361 | 51,502 | 0 | 0 | 0 | 0 | 0 |
| 1990's | 0 | 0 | 0 | 1,678 | 7,013 | 6,722 | 13,862 | 17,243 | 14,532 | 54,530 |
| 2000's | 11,601 | 10,276 | 7,699 | 5,960 | 452 | 9,320 | 12,749 | 54,062 | 47,704 | 32,131 |
| 2010's | 33,062 | 59,782 | 8,101 | 7,636 | 7,124 | 7,114 | 748 | 2,243 | 2,823 | 2,415 |
| 2020's | 3,089 | 2,789 | 1,383 | 571 | 530 |
| - = No Data Reported; -- = Not Applicable; NA = Not Available; W = Withheld to avoid disclosure of individual company data. |
| Release Date: 6/30/2026 |
| Next Release Date: 7/31/2026 |