|
Download Data (XLS File) |
|
|||||
|
|||||
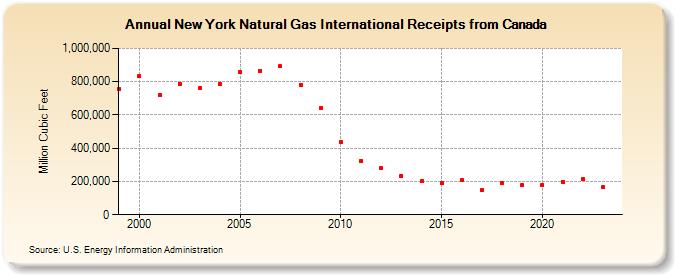
| New York Natural Gas International Receipts from Canada (Million Cubic Feet) | |||||
| Decade | Year-0 | Year-1 | Year-2 | Year-3 | Year-4 | Year-5 | Year-6 | Year-7 | Year-8 | Year-9 |
|---|---|---|---|---|---|---|---|---|---|---|
| 1990's | 754,484 | |||||||||
| 2000's | 832,762 | 718,982 | 787,619 | 761,859 | 785,055 | 856,107 | 865,952 | 892,283 | 780,862 | 640,119 |
| 2010's | 434,526 | 324,474 | 278,422 | 233,453 | 200,394 | 190,194 | 208,511 | 149,227 | 191,792 | 175,765 |
| 2020's | 179,425 | 199,465 | 214,064 | 164,517 | 236,427 |
| - = No Data Reported; -- = Not Applicable; NA = Not Available; W = Withheld to avoid disclosure of individual company data. |
| Release Date: 6/30/2026 |
| Next Release Date: 7/31/2026 |