|
Download Data (XLS File) |
|
|||||
|
|||||
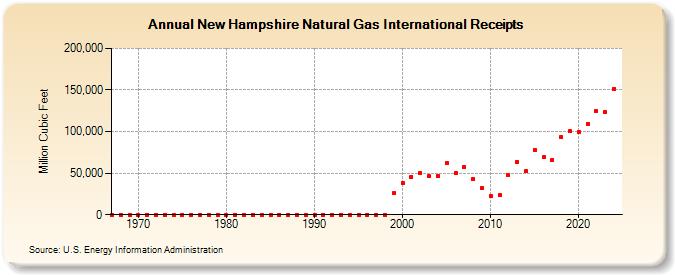
| New Hampshire Natural Gas International Receipts (Million Cubic Feet) | |||||
| Decade | Year-0 | Year-1 | Year-2 | Year-3 | Year-4 | Year-5 | Year-6 | Year-7 | Year-8 | Year-9 |
|---|---|---|---|---|---|---|---|---|---|---|
| 1960's | 0 | 0 | 0 | |||||||
| 1970's | 0 | 0 | 0 | 0 | 0 | 0 | 0 | 0 | 0 | 0 |
| 1980's | 0 | 6 | 0 | 0 | 0 | 0 | 0 | 0 | 0 | 0 |
| 1990's | 0 | 0 | 0 | 0 | 0 | 0 | 0 | 0 | 0 | 26,068 |
| 2000's | 38,289 | 45,808 | 49,640 | 46,201 | 46,960 | 61,783 | 49,677 | 56,879 | 42,561 | 32,012 |
| 2010's | 22,326 | 23,691 | 47,451 | 63,446 | 52,160 | 77,866 | 68,919 | 65,754 | 93,181 | 100,086 |
| 2020's | 99,821 | 109,240 | 124,391 | 123,456 | 151,520 |
| - = No Data Reported; -- = Not Applicable; NA = Not Available; W = Withheld to avoid disclosure of individual company data. |
| Release Date: 6/30/2026 |
| Next Release Date: 7/31/2026 |