|
Download Data (XLS File) |
|
|||||
|
|||||
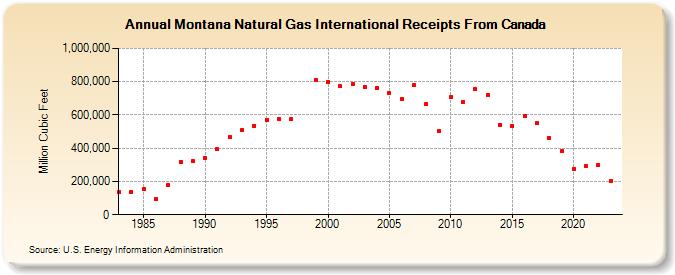
| Montana Natural Gas International Receipts From Canada (Million Cubic Feet) | |||||
| Decade | Year-0 | Year-1 | Year-2 | Year-3 | Year-4 | Year-5 | Year-6 | Year-7 | Year-8 | Year-9 |
|---|---|---|---|---|---|---|---|---|---|---|
| 1980's | 136,508 | 137,661 | 155,377 | 95,958 | 178,262 | 318,618 | 323,538 | |||
| 1990's | 343,716 | 393,463 | 467,036 | 511,294 | 535,855 | 570,396 | 576,511 | 572,977 | 807,124 | |
| 2000's | 800,026 | 771,696 | 787,652 | 767,008 | 763,149 | 728,851 | 696,989 | 779,129 | 666,251 | 502,435 |
| 2010's | 706,201 | 679,848 | 754,058 | 719,176 | 541,135 | 534,807 | 593,170 | 549,872 | 464,207 | 384,092 |
| 2020's | 275,682 | 292,121 | 298,060 | 200,854 | 189,775 |
| - = No Data Reported; -- = Not Applicable; NA = Not Available; W = Withheld to avoid disclosure of individual company data. |
| Release Date: 6/30/2026 |
| Next Release Date: 7/31/2026 |