|
Download Data (XLS File) |
|
|||||
|
|||||
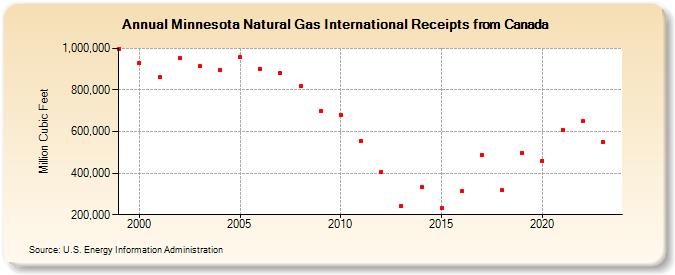
| Minnesota Natural Gas International Receipts from Canada (Million Cubic Feet) | |||||
| Decade | Year-0 | Year-1 | Year-2 | Year-3 | Year-4 | Year-5 | Year-6 | Year-7 | Year-8 | Year-9 |
|---|---|---|---|---|---|---|---|---|---|---|
| 1990's | 998,603 | |||||||||
| 2000's | 928,332 | 862,889 | 951,739 | 915,165 | 895,182 | 956,814 | 902,974 | 879,578 | 817,609 | 697,631 |
| 2010's | 680,515 | 554,738 | 406,327 | 243,805 | 330,955 | 233,011 | 312,263 | 487,541 | 316,945 | 496,527 |
| 2020's | 460,740 | 606,987 | 649,102 | 549,045 | 672,398 |
| - = No Data Reported; -- = Not Applicable; NA = Not Available; W = Withheld to avoid disclosure of individual company data. |
| Release Date: 6/30/2026 |
| Next Release Date: 7/31/2026 |