|
Download Data (XLS File) |
|
|||||
|
|||||
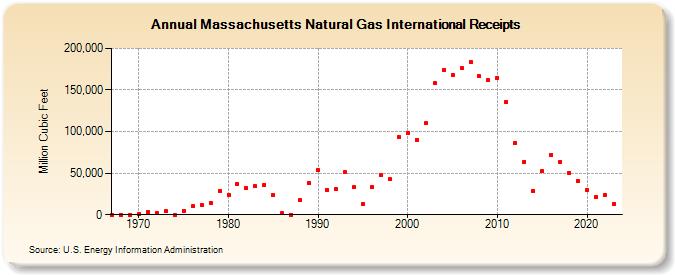
| Massachusetts Natural Gas International Receipts (Million Cubic Feet) | |||||
| Decade | Year-0 | Year-1 | Year-2 | Year-3 | Year-4 | Year-5 | Year-6 | Year-7 | Year-8 | Year-9 |
|---|---|---|---|---|---|---|---|---|---|---|
| 1960's | 0 | 0 | 0 | |||||||
| 1970's | 757 | 2,933 | 2,262 | 4,055 | 0 | 4,893 | 10,155 | 11,522 | 14,568 | 28,566 |
| 1980's | 24,274 | 36,824 | 32,022 | 34,178 | 36,191 | 23,659 | 1,669 | 0 | 17,490 | 38,229 |
| 1990's | 53,443 | 30,312 | 30,479 | 50,895 | 32,891 | 12,769 | 33,232 | 47,183 | 42,531 | 93,511 |
| 2000's | 98,838 | 90,406 | 109,763 | 158,277 | 173,780 | 168,542 | 176,097 | 183,624 | 166,247 | 161,486 |
| 2010's | 164,984 | 135,278 | 86,609 | 63,987 | 28,825 | 52,293 | 72,266 | 63,936 | 50,636 | 40,326 |
| 2020's | 29,396 | 21,423 | 23,869 | 13,188 | 11,887 |
| - = No Data Reported; -- = Not Applicable; NA = Not Available; W = Withheld to avoid disclosure of individual company data. |
| Release Date: 6/30/2026 |
| Next Release Date: 7/31/2026 |