|
Download Data (XLS File) |
|
|||||
|
|||||
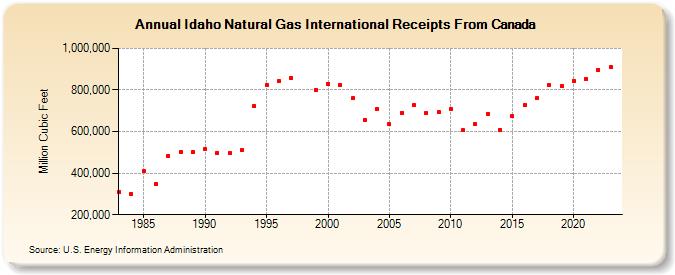
| Idaho Natural Gas International Receipts From Canada (Million Cubic Feet) | |||||
| Decade | Year-0 | Year-1 | Year-2 | Year-3 | Year-4 | Year-5 | Year-6 | Year-7 | Year-8 | Year-9 |
|---|---|---|---|---|---|---|---|---|---|---|
| 1980's | 310,811 | 299,360 | 411,380 | 348,306 | 483,547 | 503,451 | 501,477 | |||
| 1990's | 514,597 | 496,967 | 496,451 | 511,727 | 723,071 | 823,478 | 842,114 | 856,503 | 800,345 | |
| 2000's | 830,351 | 824,248 | 759,647 | 655,746 | 708,356 | 634,982 | 690,781 | 726,365 | 688,782 | 693,892 |
| 2010's | 708,806 | 606,099 | 634,194 | 686,449 | 608,147 | 673,531 | 728,183 | 760,451 | 822,536 | 818,374 |
| 2020's | 845,341 | 853,300 | 897,492 | 911,014 | 912,732 |
| - = No Data Reported; -- = Not Applicable; NA = Not Available; W = Withheld to avoid disclosure of individual company data. |
| Release Date: 6/30/2026 |
| Next Release Date: 7/31/2026 |
Referring Pages: