|
Download Data (XLS File) |
|
|||||
|
|||||
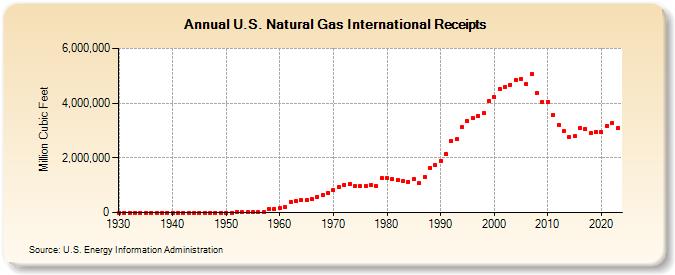
| U.S. Natural Gas International Receipts (Million Cubic Feet) | |||||
| Decade | Year-0 | Year-1 | Year-2 | Year-3 | Year-4 | Year-5 | Year-6 | Year-7 | Year-8 | Year-9 |
|---|---|---|---|---|---|---|---|---|---|---|
| 1930's | 21 | 44 | 38 | 83 | 68 | 106 | 152 | 289 | 372 | 131 |
| 1940's | 0 | 0 | 0 | 0 | 0 | 0 | 0 | 0 | 0 | 0 |
| 1950's | 0 | 0 | 7,807 | 9,225 | 6,847 | 10,888 | 10,380 | 37,941 | 135,797 | 133,990 |
| 1960's | 155,646 | 218,860 | 401,534 | 406,204 | 443,326 | 456,394 | 479,780 | 564,226 | 651,885 | 726,951 |
| 1970's | 820,780 | 934,548 | 1,019,496 | 1,032,901 | 959,284 | 953,008 | 963,768 | 1,011,002 | 965,545 | 1,253,383 |
| 1980's | 1,266,116 | 1,209,493 | 1,203,052 | 1,155,993 | 1,129,705 | 1,219,463 | 1,079,508 | 1,312,612 | 1,646,579 | 1,728,333 |
| 1990's | 1,888,660 | 2,136,174 | 2,623,667 | 2,674,207 | 3,111,599 | 3,333,530 | 3,473,745 | 3,542,173 | 3,633,638 | 4,060,604 |
| 2000's | 4,221,546 | 4,513,702 | 4,604,165 | 4,674,127 | 4,848,076 | 4,898,150 | 4,700,734 | 5,063,271 | 4,365,088 | 4,046,150 |
| 2010's | 4,057,157 | 3,579,433 | 3,197,843 | 2,978,196 | 2,757,351 | 2,779,821 | 3,080,691 | 3,046,886 | 2,901,988 | 2,949,230 |
| 2020's | 2,935,538 | 3,180,649 | 3,268,137 | 3,084,863 | 3,356,400 |
| - = No Data Reported; -- = Not Applicable; NA = Not Available; W = Withheld to avoid disclosure of individual company data. |
| Release Date: 6/30/2026 |
| Next Release Date: 7/31/2026 |