|
Download Data (XLS File) |
|
|||||
|
|||||
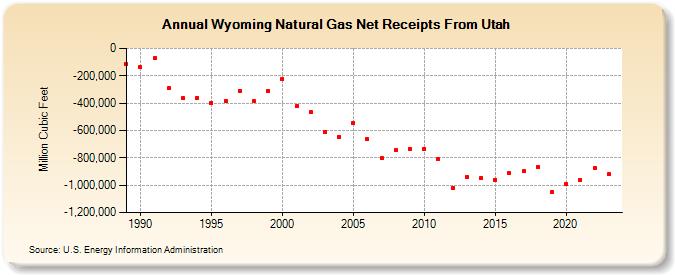
| Wyoming Natural Gas Net Receipts From Utah (Million Cubic Feet) | |||||
| Decade | Year-0 | Year-1 | Year-2 | Year-3 | Year-4 | Year-5 | Year-6 | Year-7 | Year-8 | Year-9 |
|---|---|---|---|---|---|---|---|---|---|---|
| 1980's | -113,638 | |||||||||
| 1990's | -138,018 | -73,386 | -291,519 | -363,005 | -362,046 | -396,565 | -384,311 | -308,680 | -387,288 | -308,214 |
| 2000's | -225,268 | -422,767 | -465,332 | -608,543 | -645,460 | -547,613 | -664,680 | -801,713 | -745,850 | -734,192 |
| 2010's | -732,616 | -809,127 | -1,019,443 | -941,626 | -948,490 | -960,045 | -913,679 | -899,522 | -866,210 | -1,050,690 |
| 2020's | -991,620 | -960,032 | -872,745 | -921,087 | -786,448 |
| - = No Data Reported; -- = Not Applicable; NA = Not Available; W = Withheld to avoid disclosure of individual company data. |
| Release Date: 6/30/2026 |
| Next Release Date: 7/31/2026 |