|
Download Data (XLS File) |
|
|||||
|
|||||
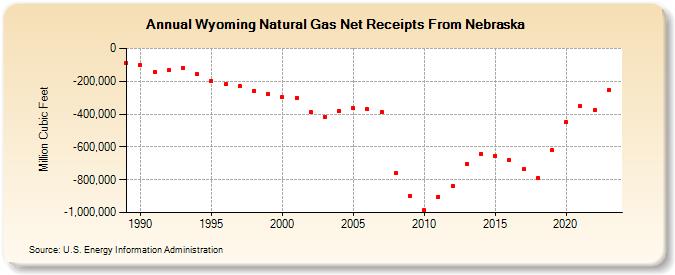
| Wyoming Natural Gas Net Receipts From Nebraska (Million Cubic Feet) | |||||
| Decade | Year-0 | Year-1 | Year-2 | Year-3 | Year-4 | Year-5 | Year-6 | Year-7 | Year-8 | Year-9 |
|---|---|---|---|---|---|---|---|---|---|---|
| 1980's | -88,620 | |||||||||
| 1990's | -102,124 | -142,009 | -131,929 | -118,136 | -158,032 | -198,286 | -219,242 | -229,312 | -257,640 | -275,629 |
| 2000's | -297,130 | -300,242 | -389,454 | -416,057 | -381,844 | -364,776 | -371,374 | -386,525 | -761,188 | -896,287 |
| 2010's | -986,235 | -903,246 | -836,660 | -704,053 | -641,826 | -653,594 | -679,815 | -735,317 | -790,295 | -621,967 |
| 2020's | -448,886 | -353,638 | -377,294 | -254,399 | -402,606 |
| - = No Data Reported; -- = Not Applicable; NA = Not Available; W = Withheld to avoid disclosure of individual company data. |
| Release Date: 6/30/2026 |
| Next Release Date: 7/31/2026 |