|
Download Data (XLS File) |
|
|||||
|
|||||
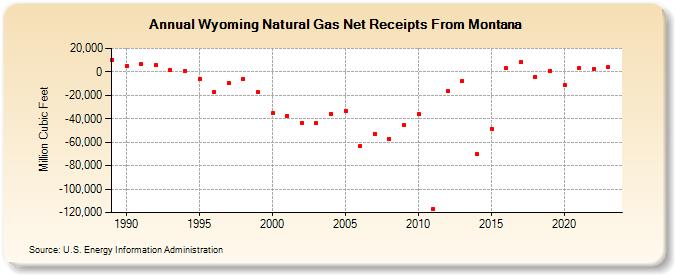
| Wyoming Natural Gas Net Receipts From Montana (Million Cubic Feet) | |||||
| Decade | Year-0 | Year-1 | Year-2 | Year-3 | Year-4 | Year-5 | Year-6 | Year-7 | Year-8 | Year-9 |
|---|---|---|---|---|---|---|---|---|---|---|
| 1980's | 10,200 | |||||||||
| 1990's | 5,182 | 6,624 | 5,777 | 1,510 | 622 | -5,880 | -16,837 | -9,459 | -5,859 | -17,369 |
| 2000's | -35,152 | -37,363 | -43,325 | -43,869 | -35,539 | -33,223 | -63,063 | -52,624 | -57,173 | -45,736 |
| 2010's | -35,917 | -116,942 | -16,714 | -7,765 | -70,365 | -48,406 | 3,137 | 8,322 | -4,214 | 980 |
| 2020's | -11,121 | 3,326 | 2,663 | 3,729 | 35,647 |
| - = No Data Reported; -- = Not Applicable; NA = Not Available; W = Withheld to avoid disclosure of individual company data. |
| Release Date: 6/30/2026 |
| Next Release Date: 7/31/2026 |