|
Download Data (XLS File) |
|
|||||
|
|||||
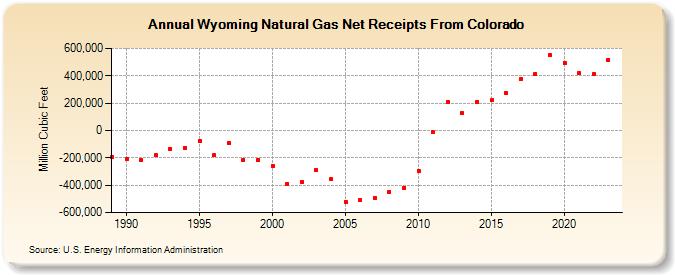
| Wyoming Natural Gas Net Receipts From Colorado (Million Cubic Feet) | |||||
| Decade | Year-0 | Year-1 | Year-2 | Year-3 | Year-4 | Year-5 | Year-6 | Year-7 | Year-8 | Year-9 |
|---|---|---|---|---|---|---|---|---|---|---|
| 1980's | -195,074 | |||||||||
| 1990's | -208,386 | -214,761 | -182,676 | -135,005 | -125,006 | -74,513 | -182,511 | -91,138 | -214,119 | -214,076 |
| 2000's | -256,202 | -388,397 | -375,244 | -288,334 | -355,543 | -519,383 | -508,557 | -490,384 | -448,467 | -417,398 |
| 2010's | -294,495 | -14,581 | 209,287 | 127,163 | 208,518 | 219,369 | 273,411 | 373,374 | 413,650 | 551,159 |
| 2020's | 494,938 | 416,864 | 411,424 | 515,993 | 521,220 |
| - = No Data Reported; -- = Not Applicable; NA = Not Available; W = Withheld to avoid disclosure of individual company data. |
| Release Date: 6/30/2026 |
| Next Release Date: 7/31/2026 |