|
Download Data (XLS File) |
|
|||||
|
|||||
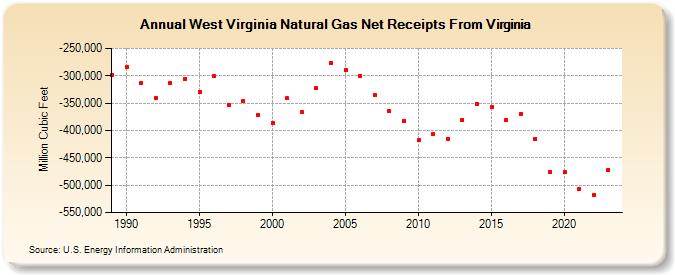
| West Virginia Natural Gas Net Receipts From Virginia (Million Cubic Feet) | |||||
| Decade | Year-0 | Year-1 | Year-2 | Year-3 | Year-4 | Year-5 | Year-6 | Year-7 | Year-8 | Year-9 |
|---|---|---|---|---|---|---|---|---|---|---|
| 1980's | -298,259 | |||||||||
| 1990's | -284,534 | -312,629 | -341,296 | -313,679 | -305,765 | -329,043 | -301,031 | -353,842 | -345,947 | -371,623 |
| 2000's | -387,080 | -341,354 | -366,468 | -322,902 | -276,918 | -289,166 | -299,731 | -335,097 | -364,977 | -382,094 |
| 2010's | -418,139 | -405,887 | -414,886 | -380,543 | -351,618 | -357,893 | -381,649 | -370,152 | -415,173 | -476,557 |
| 2020's | -476,621 | -506,441 | -517,507 | -471,501 | -497,203 |
| - = No Data Reported; -- = Not Applicable; NA = Not Available; W = Withheld to avoid disclosure of individual company data. |
| Release Date: 6/30/2026 |
| Next Release Date: 7/31/2026 |