|
Download Data (XLS File) |
|
|||||
|
|||||
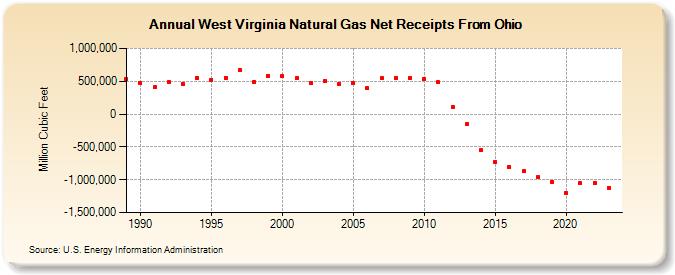
| West Virginia Natural Gas Net Receipts From Ohio (Million Cubic Feet) | |||||
| Decade | Year-0 | Year-1 | Year-2 | Year-3 | Year-4 | Year-5 | Year-6 | Year-7 | Year-8 | Year-9 |
|---|---|---|---|---|---|---|---|---|---|---|
| 1980's | 535,012 | |||||||||
| 1990's | 473,343 | 409,848 | 487,074 | 459,331 | 546,272 | 525,194 | 555,829 | 666,301 | 495,145 | 581,487 |
| 2000's | 579,954 | 547,619 | 473,866 | 504,256 | 462,751 | 471,001 | 390,666 | 544,804 | 554,734 | 549,859 |
| 2010's | 533,919 | 482,494 | 111,480 | -157,175 | -545,747 | -724,335 | -803,967 | -868,763 | -959,952 | -1,035,145 |
| 2020's | -1,196,289 | -1,053,886 | -1,046,633 | -1,125,865 | -1,120,636 |
| - = No Data Reported; -- = Not Applicable; NA = Not Available; W = Withheld to avoid disclosure of individual company data. |
| Release Date: 6/30/2026 |
| Next Release Date: 7/31/2026 |