|
Download Data (XLS File) |
|
|||||
|
|||||
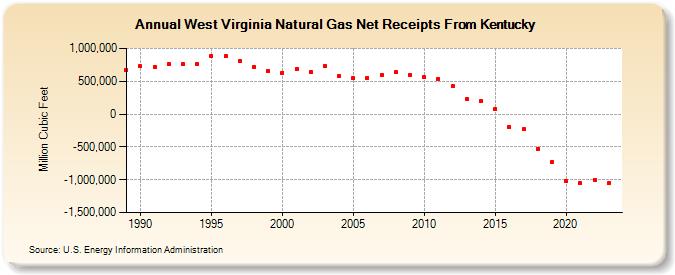
| West Virginia Natural Gas Net Receipts From Kentucky (Million Cubic Feet) | |||||
| Decade | Year-0 | Year-1 | Year-2 | Year-3 | Year-4 | Year-5 | Year-6 | Year-7 | Year-8 | Year-9 |
|---|---|---|---|---|---|---|---|---|---|---|
| 1980's | 664,431 | |||||||||
| 1990's | 725,799 | 720,638 | 764,102 | 761,572 | 758,277 | 887,561 | 877,741 | 808,019 | 720,373 | 657,374 |
| 2000's | 632,834 | 684,053 | 642,014 | 725,548 | 575,717 | 546,065 | 549,990 | 601,242 | 633,113 | 601,050 |
| 2010's | 563,196 | 535,047 | 421,700 | 231,547 | 193,679 | 73,417 | -194,418 | -232,959 | -524,673 | -728,094 |
| 2020's | -1,025,157 | -1,056,696 | -1,003,868 | -1,055,091 | -1,041,428 |
| - = No Data Reported; -- = Not Applicable; NA = Not Available; W = Withheld to avoid disclosure of individual company data. |
| Release Date: 6/30/2026 |
| Next Release Date: 7/31/2026 |