|
Download Data (XLS File) |
|
|||||
|
|||||
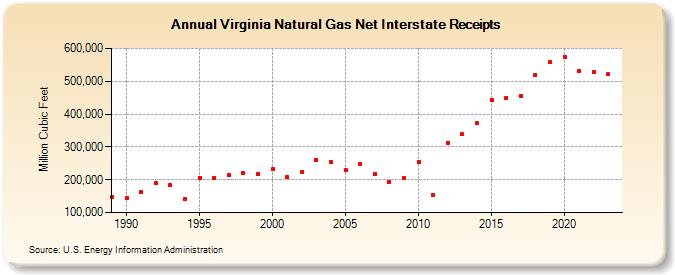
| Virginia Natural Gas Net Interstate Receipts (Million Cubic Feet) | |||||
| Decade | Year-0 | Year-1 | Year-2 | Year-3 | Year-4 | Year-5 | Year-6 | Year-7 | Year-8 | Year-9 |
|---|---|---|---|---|---|---|---|---|---|---|
| 1980's | 148,330 | |||||||||
| 1990's | 145,036 | 161,395 | 189,401 | 183,700 | 140,723 | 205,235 | 206,750 | 213,228 | 219,286 | 218,232 |
| 2000's | 232,580 | 208,908 | 223,725 | 260,674 | 254,045 | 229,957 | 247,710 | 217,536 | 193,676 | 204,117 |
| 2010's | 253,442 | 154,510 | 312,531 | 338,268 | 371,769 | 443,766 | 448,325 | 455,079 | 518,283 | 558,970 |
| 2020's | 575,109 | 531,146 | 528,256 | 520,783 | 402,560 |
| - = No Data Reported; -- = Not Applicable; NA = Not Available; W = Withheld to avoid disclosure of individual company data. |
| Release Date: 6/30/2026 |
| Next Release Date: 7/31/2026 |