|
Download Data (XLS File) |
|
|||||
|
|||||
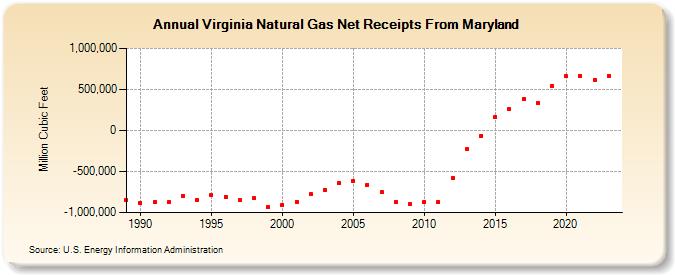
| Virginia Natural Gas Net Receipts From Maryland (Million Cubic Feet) | |||||
| Decade | Year-0 | Year-1 | Year-2 | Year-3 | Year-4 | Year-5 | Year-6 | Year-7 | Year-8 | Year-9 |
|---|---|---|---|---|---|---|---|---|---|---|
| 1980's | -841,578 | |||||||||
| 1990's | -881,098 | -874,195 | -873,524 | -795,920 | -841,756 | -791,818 | -808,882 | -848,572 | -823,358 | -930,436 |
| 2000's | -903,406 | -866,861 | -778,022 | -725,020 | -637,322 | -617,069 | -660,662 | -751,192 | -865,407 | -901,614 |
| 2010's | -865,462 | -869,550 | -578,119 | -229,818 | -63,737 | 166,974 | 260,393 | 385,835 | 340,413 | 542,642 |
| 2020's | 658,645 | 663,894 | 621,000 | 666,499 | 553,420 |
| - = No Data Reported; -- = Not Applicable; NA = Not Available; W = Withheld to avoid disclosure of individual company data. |
| Release Date: 6/30/2026 |
| Next Release Date: 7/31/2026 |