|
Download Data (XLS File) |
|
|||||
|
|||||
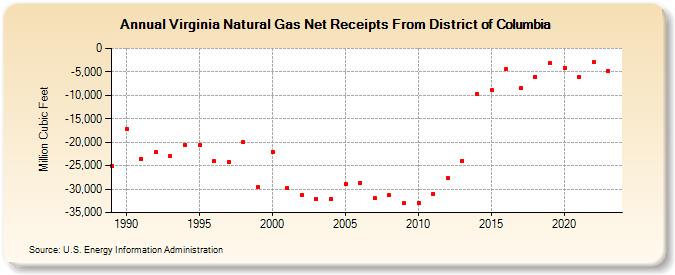
| Virginia Natural Gas Net Receipts From District of Columbia (Million Cubic Feet) | |||||
| Decade | Year-0 | Year-1 | Year-2 | Year-3 | Year-4 | Year-5 | Year-6 | Year-7 | Year-8 | Year-9 |
|---|---|---|---|---|---|---|---|---|---|---|
| 1980's | -25,121 | |||||||||
| 1990's | -17,174 | -23,552 | -22,076 | -23,005 | -20,581 | -20,656 | -24,093 | -24,265 | -20,029 | -29,538 |
| 2000's | -22,024 | -29,805 | -31,195 | -32,020 | -32,024 | -29,002 | -28,624 | -31,974 | -31,264 | -33,026 |
| 2010's | -32,996 | -30,976 | -27,606 | -23,945 | -9,777 | -8,915 | -4,475 | -8,539 | -6,089 | -3,124 |
| 2020's | -4,097 | -6,092 | -2,943 | -4,852 | -7,133 |
| - = No Data Reported; -- = Not Applicable; NA = Not Available; W = Withheld to avoid disclosure of individual company data. |
| Release Date: 6/30/2026 |
| Next Release Date: 7/31/2026 |