|
Download Data (XLS File) |
|
|||||
|
|||||
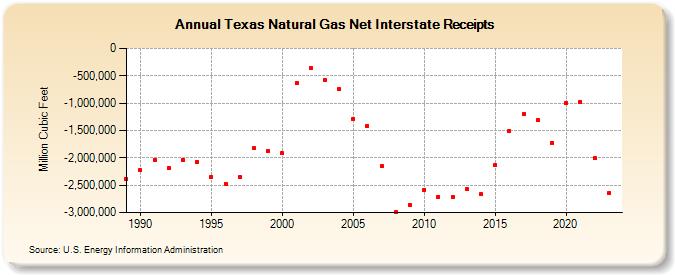
| Texas Natural Gas Net Interstate Receipts (Million Cubic Feet) | |||||
| Decade | Year-0 | Year-1 | Year-2 | Year-3 | Year-4 | Year-5 | Year-6 | Year-7 | Year-8 | Year-9 |
|---|---|---|---|---|---|---|---|---|---|---|
| 1980's | -2,391,011 | |||||||||
| 1990's | -2,229,743 | -2,032,327 | -2,181,297 | -2,033,746 | -2,068,270 | -2,350,016 | -2,472,067 | -2,347,584 | -1,827,728 | -1,876,170 |
| 2000's | -1,920,725 | -636,350 | -359,339 | -586,674 | -744,632 | -1,285,030 | -1,410,951 | -2,150,974 | -2,991,093 | -2,861,241 |
| 2010's | -2,583,198 | -2,712,590 | -2,713,190 | -2,572,397 | -2,669,863 | -2,133,208 | -1,505,575 | -1,200,001 | -1,305,275 | -1,721,292 |
| 2020's | -1,002,059 | -973,707 | -2,006,821 | -2,644,377 | -3,027,897 |
| - = No Data Reported; -- = Not Applicable; NA = Not Available; W = Withheld to avoid disclosure of individual company data. |
| Release Date: 6/30/2026 |
| Next Release Date: 7/31/2026 |
Referring Pages: