|
Download Data (XLS File) |
|
|||||
|
|||||
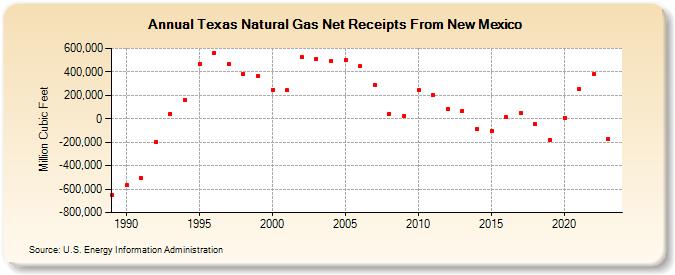
| Texas Natural Gas Net Receipts From New Mexico (Million Cubic Feet) | |||||
| Decade | Year-0 | Year-1 | Year-2 | Year-3 | Year-4 | Year-5 | Year-6 | Year-7 | Year-8 | Year-9 |
|---|---|---|---|---|---|---|---|---|---|---|
| 1980's | -654,136 | |||||||||
| 1990's | -567,347 | -503,026 | -197,034 | 44,375 | 162,677 | 465,659 | 564,358 | 466,583 | 385,351 | 367,741 |
| 2000's | 248,708 | 241,202 | 525,383 | 513,764 | 488,296 | 500,390 | 446,358 | 291,560 | 44,326 | 25,032 |
| 2010's | 245,033 | 199,171 | 81,845 | 67,210 | -91,287 | -100,709 | 14,117 | 52,017 | -48,846 | -177,228 |
| 2020's | 8,816 | 253,114 | 381,356 | -173,879 | -170,578 |
| - = No Data Reported; -- = Not Applicable; NA = Not Available; W = Withheld to avoid disclosure of individual company data. |
| Release Date: 6/30/2026 |
| Next Release Date: 7/31/2026 |
Referring Pages: