|
Download Data (XLS File) |
|
|||||
|
|||||
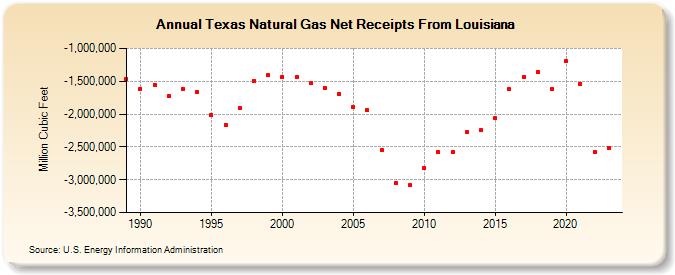
| Texas Natural Gas Net Receipts From Louisiana (Million Cubic Feet) | |||||
| Decade | Year-0 | Year-1 | Year-2 | Year-3 | Year-4 | Year-5 | Year-6 | Year-7 | Year-8 | Year-9 |
|---|---|---|---|---|---|---|---|---|---|---|
| 1980's | -1,458,579 | |||||||||
| 1990's | -1,613,109 | -1,550,125 | -1,722,647 | -1,621,932 | -1,660,022 | -2,008,509 | -2,168,249 | -1,911,682 | -1,491,179 | -1,411,490 |
| 2000's | -1,433,823 | -1,441,206 | -1,531,041 | -1,600,263 | -1,691,499 | -1,896,706 | -1,939,791 | -2,545,387 | -3,051,973 | -3,087,872 |
| 2010's | -2,825,254 | -2,579,540 | -2,583,087 | -2,278,647 | -2,248,509 | -2,066,229 | -1,623,336 | -1,433,693 | -1,358,099 | -1,620,847 |
| 2020's | -1,193,565 | -1,537,152 | -2,577,173 | -2,513,453 | -2,887,595 |
| - = No Data Reported; -- = Not Applicable; NA = Not Available; W = Withheld to avoid disclosure of individual company data. |
| Release Date: 6/30/2026 |
| Next Release Date: 7/31/2026 |
Referring Pages: