|
Download Data (XLS File) |
|
|||||
|
|||||
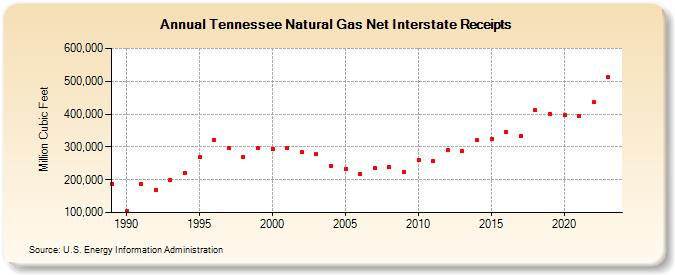
| Tennessee Natural Gas Net Interstate Receipts (Million Cubic Feet) | |||||
| Decade | Year-0 | Year-1 | Year-2 | Year-3 | Year-4 | Year-5 | Year-6 | Year-7 | Year-8 | Year-9 |
|---|---|---|---|---|---|---|---|---|---|---|
| 1980's | 187,111 | |||||||||
| 1990's | 104,733 | 185,802 | 168,860 | 200,614 | 220,081 | 268,584 | 321,649 | 296,613 | 268,165 | 295,768 |
| 2000's | 294,882 | 295,599 | 284,074 | 277,040 | 241,217 | 233,074 | 216,413 | 234,854 | 238,537 | 222,803 |
| 2010's | 259,450 | 255,672 | 289,408 | 286,969 | 320,124 | 324,844 | 346,751 | 331,971 | 411,733 | 400,810 |
| 2020's | 396,177 | 395,467 | 435,791 | 511,789 | 401,822 |
| - = No Data Reported; -- = Not Applicable; NA = Not Available; W = Withheld to avoid disclosure of individual company data. |
| Release Date: 6/30/2026 |
| Next Release Date: 7/31/2026 |