|
Download Data (XLS File) |
|
|||||
|
|||||
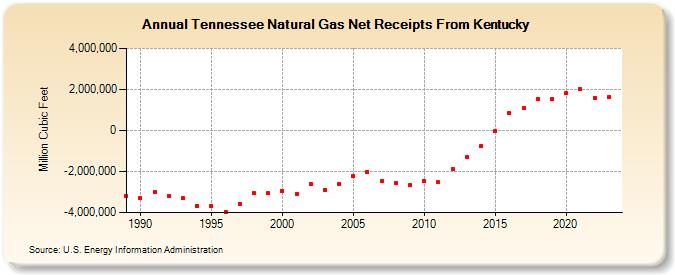
| Tennessee Natural Gas Net Receipts From Kentucky (Million Cubic Feet) | |||||
| Decade | Year-0 | Year-1 | Year-2 | Year-3 | Year-4 | Year-5 | Year-6 | Year-7 | Year-8 | Year-9 |
|---|---|---|---|---|---|---|---|---|---|---|
| 1980's | -3,201,294 | |||||||||
| 1990's | -3,296,414 | -3,022,442 | -3,189,664 | -3,308,074 | -3,657,178 | -3,681,871 | -3,949,766 | -3,570,228 | -3,058,358 | -3,068,302 |
| 2000's | -2,943,801 | -3,082,043 | -2,620,190 | -2,879,309 | -2,603,184 | -2,231,338 | -2,019,039 | -2,465,789 | -2,577,529 | -2,669,666 |
| 2010's | -2,472,115 | -2,524,659 | -1,889,408 | -1,309,073 | -760,621 | -18,300 | 836,073 | 1,076,257 | 1,553,294 | 1,529,281 |
| 2020's | 1,826,345 | 2,025,462 | 1,594,319 | 1,642,995 | 1,874,073 |
| - = No Data Reported; -- = Not Applicable; NA = Not Available; W = Withheld to avoid disclosure of individual company data. |
| Release Date: 6/30/2026 |
| Next Release Date: 7/31/2026 |