|
Download Data (XLS File) |
|
|||||
|
|||||
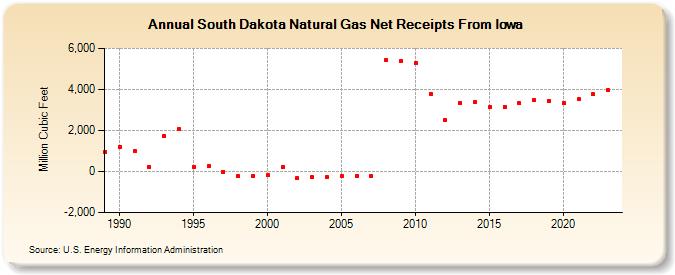
| South Dakota Natural Gas Net Receipts From Iowa (Million Cubic Feet) | |||||
| Decade | Year-0 | Year-1 | Year-2 | Year-3 | Year-4 | Year-5 | Year-6 | Year-7 | Year-8 | Year-9 |
|---|---|---|---|---|---|---|---|---|---|---|
| 1980's | 965 | |||||||||
| 1990's | 1,217 | 989 | 222 | 1,734 | 2,052 | 234 | 267 | -8 | -233 | -222 |
| 2000's | -176 | 214 | -333 | -281 | -272 | -217 | -230 | -235 | 5,411 | 5,369 |
| 2010's | 5,267 | 3,790 | 2,491 | 3,331 | 3,371 | 3,122 | 3,144 | 3,318 | 3,474 | 3,454 |
| 2020's | 3,329 | 3,511 | 3,762 | 3,958 | 3,892 |
| - = No Data Reported; -- = Not Applicable; NA = Not Available; W = Withheld to avoid disclosure of individual company data. |
| Release Date: 6/30/2026 |
| Next Release Date: 7/31/2026 |